Blog
Test-retest Variability of a Standardized Low Vision Lighting Assessment
SIGNIFICANCE: Systematic lighting assessments should be part of low vision evaluations. The LuxIQ has gained popularity as an assessment tool, but its reliability has not been examined independently and is necessary for evidence-based vision rehabilitation.
PURPOSE: Besides magnification, improved lighting levels are a common intervention in reading rehabilitation for individuals with low vision. Determining the appropriate lighting can be a complex and time-consuming task. The LuxIQ is a portable lighting assessment tool that can be used to systematically measure lighting preferences; however, there is little independent evidence to support its reliability in low vision rehabilitation.
METHODS: One hundred nine control subjects (age, 18 to 85 years) and 64 individuals with low vision (age, 27 to 99 years) adjusted both the luminance and color temperature parameters on the LuxIQ while viewing a sentence on the MNREAD at their preferred print size for continuous reading. After 30 minutes, they were asked to repeat the same measurements.
RESULTS: Using Bland-Altman plots, test-retest variability was calculated using the limits of agreement (LOAs). For illuminance, the LOA width was 2806 lux for control subjects and 2657 lux for visually impaired participants. For color temperature, the LOA width was 2807 K for control subjects and 2364 K for those with a visual impairment. Difference scores were centered near zero, indicating overall accuracy.
CONCLUSIONS: The measurement of lighting preference lacks the precision necessary for clinical utility, given that the LOA for luminance ranged more than 2600 lux, with normally sighted and low vision participants. Such variability translates into a range of approximately ±40 or 50 W in an incandescent light bulb, depending on the luminance level,making it clinically difficult to narrow down the options for evidence-based lighting recommendations. Next steps are to examine whether the reading behavior of low vision clients is positively affected by interventions that are based on LuxIQ recommendations.

Optom Vis Sci 2018;95:852–858. doi:10.1097/OPX.0000000000001275 Copyright © 2018 The Author(s). Published by Wolters Kluwer Health, Inc. on behalf of the American Academy of Optometry. This is an open-access article distributed under the terms of the Creative Commons Attribution-Non Commercial-No Derivatives License 4.0 (CCBY-NC-ND), where it is permissible to download and share the work provided it is properly cited. The work cannot be changed in any way or used commercially without permission from the journal.
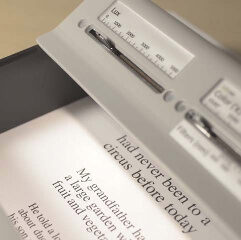
The most common functional complaint of individuals with visual impairment is difficulty with reading, which frequently results in a referral to vision rehabilitation services.1 In fact, more than 60%of the patients referred to a low vision rehabilitation center experience trouble with reading.2 Owsley et al.3 reported that reading difficulty was the most frequent cause for patients with age-related macular degeneration to seek rehabilitation (86% of patients). Two rehabilitation interventions aimed at improving reading performance are magnification4 and increased lighting level.5 Determining the appropriate lighting intervention can be complex and time consuming. 6 One possible solution to this problem is a new device called the LuxIQ (Jasper Ridge Inc., San Mateo, CA; Fig. 1), a portable lighting assessment tool. However, there is little independent evidence to support the validity and reliability of the LuxIQ in low vision rehabilitation, a gap the present study aimed to fill.
It is a frequent assumption in vision rehabilitation that increasing light levels will result in increased performance.7–14 It is also frequently found that the lighting levels in clients’ homes are suboptimal. For example, Cullinan et al.15 and Brunnström et al.16 reported that habitual home lighting levels were very low (e.g., 20 to 30 lux) and that visual performance on some tasks benefits from increased lighting. However, assessment of the lighting needs of low vision clients is often based on trial and error. Perlmutter et al.6 demonstrated that, although standard measures that include the use of lighting in home environments existed, practitioners generally did not systematically include home lighting evaluation in low vision rehabilitation.

The main problem with systematically evaluating and measuring lighting in low vision rehabilitation is that current assessment tools and methods are complex and inefficient. Although light meters are readily available, they are not commonly found in all rehabilitation centers, and most professionals are unfamiliar with their use because of lack of training and/or exposure.17 TheHome Environment Lighting Assessment6 does contain light meter use; however, this protocol has not been fully integrated into standard low vision care. In addition, the trial-and-error process of determining the appropriate light source for a specific task under a specific condition would require a large number of lamps, light bulbs, and test materials to be transported into the home. The LuxIQ is marketed as a clinical user-friendly assessment tool for determining patients preferred lighting levels. The intended purpose of this device is to simplify the prescription of lighting interventions in low vision rehabilitation by easily evaluating subjective preferences. The LuxIQ allows for the practitioner or the client to adjust light illuminance and color temperature while viewing text materials. Intensity can b varied over a nominal range from 0 to 5000 lux, and color temperature can be varied over a nominal range from 2700 to 6500 K. Illuminance and color temperature can be continuously adjusted with a mechanical slider. The suggested procedure for determining a client’s preference is quite simple, and the test takes only a few minutes. A client is asked to move a slider to adjust the light level to his/her preferred level and then is asked to set the color temperature to the preferred level, starting at 6500 K (cold white). Using these values, a manufacturer-provided reference table is used to select an appropriate light bulb and a lamp to obtain these levels in the real world.
Given the potential of this device to aid in prescribing appropriate lighting to low vision clients, the time is right to examine the physical and psychophysical properties of the LuxIQ and provide data that can inform evidence-based practice. Therefore, we assessed the test-retest variability of the LuxIQ in fully sighted and visually impaired individuals.
Methods
Participants
One hundred nine control subjects and 64 low vision clients were recruited. Control participants were fully sighted clients at the Clinique universitaire de la vision of the School of Optometry, University of Montreal, whereas data of low vision participants were collected among the rehabilitation clients of the CRIR/Centre de réadaptation MAB-Mackay du CIUSSS du Centre-Ouest-de-l’Îlede-Montréal. The mean age (standard deviation, range) of control subjects was 42 (17, 18 to 85) years, and that of low vision participants was 76 (18, 27 to 99) years. Demographics and descriptive variables of the study participants are shown in Table 1. The study protocol was approved by the institutional review board of the Centre de recherche interdisciplinaire en réadaptation du Montréal métropolitain (CRIR no. 1091-0715), and all participants provided informed written consent.


Calibrations
The reading area framed by the LuxIQ spans 17.9 cm wide and7.4 cm high. The illuminances generated by the LuxIQ within this framed area were measured using a Hagner Universal Photometer S2 (B Hagner AB, Solna, Sweden) whose probe was placed under the LuxIQ at the same plane as the text material. Measurements were taken with the room lights off, with the LuxIQ as the only source of illumination. Measurements were obtained at three horizontal locations (left, center, and right sides of the illuminated area). The slider was adjusted in 500-lux increments ascending from the slider position of 0 to 5000 lux and then descending from 5000 to 0 lux, thus generating two repeated measurements for each illuminance setting. The device was fully recharged in between each use to ensure optimal illuminance output.
Procedures
Participants were seated at a table, and an MNREAD reading acuity chart was placed on an angled reading stand at a distance of 40 cm. The MNREAD reading acuity chart was chosen because of its high validity and reliability18 and its previous use in low vision reading assessment in patients with age-related macular degeneration7 and glaucoma.19 The coefficients of repeatability of this reading test are ±0.05 logMAR for reading acuity, ±0.12 logMAR for critical print size, and ±8.6 words per minute for reading speed.20 The setting for fully sighted participants was a controlled laboratory environment with 62.0 Cd/m2 background illumination (168.3 lux in illuminance on the MNREAD reading acuity chart). Data with low vision participants were collected in their individual homes during rehabilitation home visits. Therefore, the lighting conditions varied widely but were consistent for each participant; however, they were always within the photopic range, according to the low vision rehabilitation professionals who collected the data. All participants had at least 20 minutes to adapt to their respective lighting conditions, during which the informed consent for the study was obtained.
Participants viewed the chart binocularly and chose a sentence print size they would find comfortable for extended reading under ambient lighting conditions. All individuals who collected data underwent an online training session via Skype (Microsoft Corporation, Redmond, WA), provided either by an employee of Jasper Ridge, the vendor of the LuxIQ, or by someone who had received such instruction, as this training is included in the purchase of the device. A LuxIQ Light Exam System (Jasper Ridge Inc.) was placed over the sentence (Fig. 1), and participants were asked to adjust illuminance using the slider to a level they would find comfortable for extended binocular reading. For this initial measurement, color temperature was fixed at 6500 K, and participants were allowed to take as much time as they needed. Once the illuminance was set, participants were then instructed to adjust the color temperature to a preferred level. Finally, participants were asked to readjust illuminance at their preferred color temperature. Thirty minutes later, participants were asked to repeat the same protocol (trial 2). Please note that the units on the sliding levers were covered during the experiment to avoid influencing participants’ choices.
Results
Calibration
A repeated-measures analysis of variance did not find a significant effect of repeat illuminance measurements, but it did find statistically significant differences as a function of measurement location (left, center, right; F2,18 = 162.145, P ≥ .001). The average measured illuminance for each slider position for the three locations is plotted in Fig. 2. For all locations, there was no light emitted by the LuxIQ until the slider was moved greater than 500 lux. Although the illuminance at all three locations increased with increasing slider positions greater than 500 lux, the slopes of the two peripheral locations were shallower than that of the middle position. Importantly, the shape of the illuminance versus slider position curve was not linear. Compressive nonlinearities were seen with higher slider positions. For the center position, the differences between slider-indicated lux and actual measured lux were approximately −500 lux at the lowest and highest slider settings, with a difference of only −300 lux at intermediate settings. For the lateral positions, the differences were − 500 lux at the lowest setting but continuously increased as the slider settings were increased, reaching a difference of near 1500 lux at a slider setting of 5000.
Control Variables
Independent-samples t tests were used to compare participant groups on illuminance and color preferences at each time point (Table 2). Individuals with low vision preferred statistically significantly warmer color temperatures and dimmer illuminance settings than fully sighted controls, both at test and at retest, respectively. Multivariate linear regression analyses were performed to assess the independent influences of sex, age, acuity, and letter contrast threshold (MARS test)21 on the LuxIQ settings. None of the factors predicted color temperature or illuminance settings.

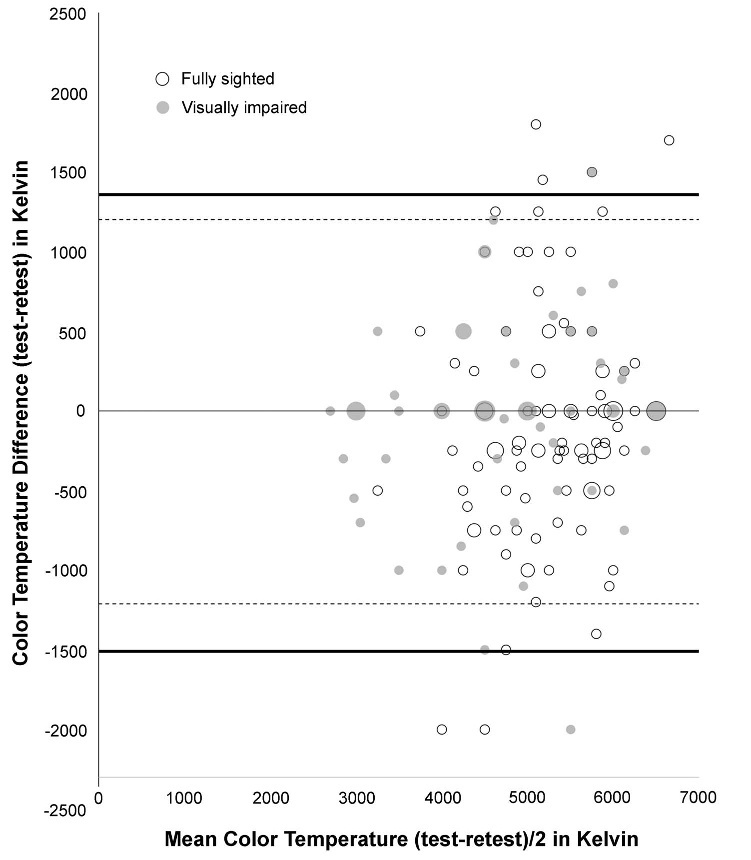
The repeatability of the choice of illuminance and color temperature was assessed by comparing values between trial 1 and trial 2. As suggested by Bland and Altman,22–25 the differences in illuminance and color temperature values between the two trials are plotted against the average of the values on the two trials. Any systematic differences between settings on trial 1 and trial 2 are reflected in the mean difference score. For the illuminance, average lux settings in the second trial were 155.0 lux higher than those in trial 1 for control participants and 64.1 lux higher for visually impaired participants (Fig. 3). For color temperature, the mean difference for control participants was 75.9 K higher on the second trial, and for visually impaired participants, it was 4.7 K higher than that on trial 1 (Fig. 4).

The width of the limits of agreement (=mean value ± [1.96 the standard deviation of difference scores]) defines the range over which 95%of the repeat data are distributed. We interpret the limit of agreement from a clinical perspective; that is, is the range of values obtained on repeated testing narrow enough to allow for a clinically useful assessment of the underlying psychophysical preferences for illuminance and color? For the illuminance values, the limit of agreement for control participants was 2806 lux. That is, 95% of the differences in scores on repeated testing could statistically range ±1400 lux from the initial score. For visually impaired participants, illuminance limit of agreement was 2657.4 lux. For color temperature, the limits of agreement were 2807.6 K for fully sighted participants and 2364.8 K for visually impaired individuals.
In the context of Bland-Altman plots, accuracy refers to the placement of the limit of agreement in relation to zero. Ideally, the limits of agreement are centered on or near and contain zero, indicating equivalence of the two testing results. Both illuminance and color temperature limits of agreement contained zero, whereby the means of the illuminance difference scores were −155 and −64 lux, and mean color temperature scores were −76 and −5 K for fully sighted and visually impaired participants, respectively. In addition, a significant shift in scores between testing points can be examined with the use of paired-samples t tests, whereby Cohen d can be used as a measure of magnitude. For illuminance scores, this shift of 155 lux in fully sighted participants was statistically significant (t108 = −2.27, P = .03, d = −0.22); however, for visually impaired participants, this difference was not significant (t108 = −0.76, P = .45, d = −0.12). For color temperature scores, neither group demonstrated statistically significant shifts in the difference scores (t63 = −1.11 [P = .27, d = −0.11] and t63 = −0.06 [P = .95, d = −0.02], respectively).
Bias refers to any systematic relationship of the differences between the two test scores as a function of the mean of the two test scores, for example, whether the differences between scores increase for individuals who score higher on the test. This was evaluated using Pearson correlation coefficients, whereby the data indicated no significant correlation for fully sighted or visually impaired participants for the illuminance measures (r2 = 0.01 and 0.02, respectively) and the color temperature measures (r2 = 0.03 for both groups).
The magnitude of the intertrial differences varied across participants. We performed multivariate regression to determine if the differences could be predicted by demographics. None of the variables (age, sex, acuity, contrast sensitivity) predicted the difference between trial measurements for illuminance or for color temperature.
Discussion
The purpose of the present study was to examine the test-retest variability of the LuxIQ in fully sighted individuals and those with low vision. We began by testing the calibration of the device and found some deviations. Specifically, we found that the light-emitting diodes did not turn on until the slider reached the 500-lux position (similar to the requirement of a minimum forward voltage seen in light-emitting diode circuits), that a compressive nonlinearity between slider settings and light outputs was observed at higher slider positions (another property commonly seen in light-emitting diode outputs at higher driving currents), and that illuminance varied as a function of position in the light field of the device. In addition, the relationship between the lux indicators printed on the slide scale and physical light intensity was not accurate or linear. However, we found that repeatability of the physical light measurement at any given slider position was high.
We observed large differences between the initial preferred levels and repeated illuminance and temperature choices, which are comparable with illuminance preference ranges previously reported when examining reading behavior in fully sighted university students.26 As far as the clinical usefulness of the device is concerned, our results indicate that measuring illuminance choice with this device lacks precision. Limits of agreement for illuminance ranged over 2700 lux for both participant groups. Practically, this variation in choice levels translates into an approximately ±50-W difference in the incandescent light bulb prescribed by Web-based app that is linked to the LuxIQ. For example, when entering the lighting preference at 2000 lux/5000 K, the LuxIQ light bulb calculator suggested an incandescent bulb of 74W; however, if we repeated the calculation with a conservative estimate of variability of ±1000 lux at the same color temperature, the resulting recommendations were 37 and 111 W for the 1000- and 3000-lux preferences, respectively. Such variability makes it clinically difficult to narrow down the options to a clear evidence-based lighting recommendation. Similarly, the color temperature measurements ranged more than 2400 K, undermining a confidence in the repeatability of this measure.
The lack of reliability could be caused by a combination of the instrument used to measure a subject’s choice and the psychophysical variability around this choice. We know from our calibration data that if a subject chose the same illuminance levels based on his/her psychophysical preference this should result in similar settings on the instrument’s slider scale. Small error in the sliders position would not account for the large variability that we observed. For example, to get an illumination difference of ±1550 lux between repeated choices, the slider position would have to be misadjusted by approximately +20 mm. This suggests that the locus of variability lies in the subject’s psychophysical judgment, which then also limits the potential for recommendations to improve the reliability of the test. That is, a difference of up to ±1500 lux was not perceived as meaningful under the condition of reading suprathreshold sentences in photopic illuminance conditions. Seiple27 has recently published data showing that reading speeds are relatively unaffected by illuminance once photopic levels are reached.
The data presented here need to be viewed within the context of several limitations. First, only one LuxIQ of the first generation of lighting examination systems was tested; this model has since been replaced with the LuxIQ/2. Therefore, some of the technical aspects of our data may differ with the new model. Second, all participants were unfamiliar with the device and provided only two measurements. It is possible that repeated administration of the LuxIQ and familiarity with its settings may result in more consistency over time; however, such familiarity would unlikely be found in the clinical context, as most rehabilitation participants receive only one lighting assessment as part of their intervention. Third, it is possible that illuminance judgments may have been influenced by the text size of the MNREAD reading acuity chart sentences, as participants with lower acuities would have chosen larger fonts that covered a larger area of the reading area. However, luminance perception for reading using a small section of the retina should be based on local information instead of a global perception across a larger area. Finally, some participants may have perceived changes in illuminance as they adjusted color temperature, which is why the protocol allowed them to readjust their illuminance judgment after choosing the temperature setting. This effect has been shown to be present but small.28
The present data indicate that the use of the LuxIQ will require additional investigation to strengthen the relevant data foundation. Ultimately, the judgment as to whether the use of the LuxIQ contributes toward improved lighting assessment and recommendations, based on client preferences, needs to be made using a variety of factors. For example, compared with the traditional trial-and-error approach, the LuxIQ provides a systematic approach that saves substantial clinical intervention time (5 vs. >30 minutes). In addition, education about the need for optimal lighting can easily be accomplished by demonstrating different light levels and color temperatures, using readily available reading materials that are relevant to the client. Such education can be beneficial for clients, their family members, and care providers, as well as vision rehabilitation professionals who are not yet familiar with the need and importance of optimal lighting.
The next question that will need to be addressed is whether the reading behavior of low vision clients is positively affected by lighting interventions that are based on LuxIQ recommendations. Specifically, examinations of measures of reading speed, reading comprehension, and reading behavior (e.g., frequency and duration) will be of interest and whether they result in an increase of reading time, desire to read, and perceived comfort. These increases may emerge, given that the new lighting environment would be based on clients’ preferred lighting conditions and that individuals may have been educated about the importance of optimal lighting. The impact of standardized lighting assessments becomes clear when considering that, for example, eye chart illuminance standards for the measurement of visual acuity under photopic conditions have been developed and validated. 29 Today, it would not occur to any eye care specialist or vision researcher to evaluate acuity under nonoptimal conditions; however, the assessment of functional ability in individuals with vision loss under nonoptimal lighting has not yet progressed to this level of sophistication. The present study aimed to take us into this direction by adding to the ongoing discussion about the relationship between lighting and reading in low vision.
ARTICLE INFORMATION
Submitted: January 31, 2018
Accepted: June 19, 2018
Funding/Support: Fonds de Recherche du Québec—Santé (28881 and 30620; to WW) and CRIR New Initiatives (to WW).
Conflict of Interest Disclosure: None of the authors have reported a financial conflict of interest.
Author Contributions and Acknowledgments: Conceptualization: WW, LSA,WS; Data Curation:WW, LSA, JJ, WS; Formal Analysis: WW, LSA, JJ, WS; Funding Acquisition: WW, WS; Investigation: WW, LSA, WS; Methodology: WW, LSA, JJ, WS; Project Administration: WW, LSA, JJ, WS; Resources: WW, WS; Software: WW, WS; Supervision: WW, WS; Validation: WW, LSA, JJ, WS; Visualization: WW, LSA, JJ, WS; Writing – Original Draft: WW, LSA, JJ, WS; Writing – Review & Editing: WW, LSA, JJ, WS.
The authors thank Marie-Claude Héroux, Sandra Fordham, Cassie Anne Ellis, Catherine Rondeau, Yousra Senhaji, and Elie Islam for their contribution to this article.
Author Affiliations: 1School of Optometry, Université de Montréal, Montreal, Quebec, Canada
2CRIR/Centre de réadaptation MAB-Mackay du CIUSSS du Centre-Ouest-de-l’Île-de-Montréal, Montreal, Quebec, Canada
3CRIR/Institut Nazareth et Louis-Brailledu CISSS de la Montérégie-Centre, Longueuil, Quebec, Canada
4Lighthouse Guild, New York, New York
5New York University Medical Center, New York, New York
REFERENCES
1. Brown JC, Goldstein JE, Chan TL, et al. Characterizing Functional Complaints in Patients Seeking Outpatient Low-vision Services in the United States. Ophthalmology 2014;121:1655–62.e1.
2. Rubin GS. Measuring Reading Performance. Vision Res 2013;90:43–51.
3. Owsley C, McGwin G, Jr., Lee PP, et al. Characteristics of Low-vision Rehabilitation Services in the United States. Arch Ophthalmol 2009;127:681–9.
4. Matchinski T, Brilliant R, Bednarski M. Low Vision Near Systems I: Microscopes and Magnifiers. In: Brilliant R, ed. Essentials of Low Vision Practice. Boston, MA: Butterworth-Heinemann/Elsevier; 1999.
5. Williams DR. Nonoptical and Accessory Devices. In: Brilliant R, ed. Essentials of Low Vision Practice. Boston, MA: Butterworth-Heinemann; 1999:269–90.
6. Perlmutter MS, Bhorade A, Gordon M, et al. Home Lighting Assessment for Clients with Low Vision. Am J Occup Ther 2013;67:674–82.
7. Bowers AR, Meek C, Stewart N. Illumination and Reading Performance in Age-related Macular Degeneration. Clin Exp Optom 2001;84:139–47.
8. Haymes SA, Lee J. Effects of Task Lighting on Visual Function in Age-relatedMacular Degeneration. Ophthalmic Physiol Opt 2006;26:169–79.
9. Bullimore MA, Bailey IL. Reading and Eye Movements in Age-related Maculopathy. Optom Vis Sci 1995;72:125–38.
10. Eldred KB. Optimal Illumination for Reading in Patients with Age-related Maculopathy. Optom Vis Sci 1992;69:46–50.
11. Sloan LL, Habel A, Feiock K. High Illumination as an Auxiliary Reading Aid in Diseases of the Macula. Am J Ophthalmol 1973;76:745–7.
12. Fosse P, Valberg A. Lighting Needs and Lighting Comfort during Reading with Age-related Macular Degeneration. J Vis Impair Blind 2004;98:389–409.
13. Smith SW, Rea MS. Proofreading under Different Levels of Illumination. J Illum Eng Soc 1978;8:47–52.
14. Smith SW, Rea MS. Performance of a Reading Test under Different Levels of Illumination. J Illum Eng Soc 1982;12:29–33.
15. Cullinan TR, Gould ES, Silver JH, et al. Visual Disability and Home Lighting. Lancet 1979;313: 642–4.
16. Brunnström G, Sörensen S, Alsterstad K, et al. Quality of Light and Quality of Life—the Effect of Lighting Adaptation among People with Low Vision. Ophthalmic Physiol Opt 2004;24:274–80.
17. WittichW, Jarry J, Barstow E, et al. Vision and Hearing Impairment and Occupational Therapy Education: Needs and Current Practice. Br J Occup Ther 2017; 80:384–91.
18. Brussee T, van Nispen RM, van Rens GH. Measurement Properties of Continuous Text Reading Performance Tests. Ophthalmic Physiol Opt 2014;34:636–57.
19. Ishii M, Seki M, Harigai R, et al. Reading Performance in Patients with Glaucoma Evaluated Using the MNREAD Charts. Jpn J Ophthalmol 2013;57:471–4.
20. Subramanian A, Pardhan S. The Repeatability of MNREAD Acuity Charts and Variability at Different Test Distances. Optom Vis Sci 2006;83:572–6.
21. Dougherty BE, Flom RE, Bullimore MA. An Evaluation of the Mars Letter Contrast Sensitivity Test. Optom Vis Sci 2005;82:970–5.
22. Bland JM, Altman DG. Statistical Methods for Assessing Agreement between Two Methods of Clinical Measurement. Lancet 1986;1:307–10.
23. Altman DG, Bland JM. Measurement in Medicine: The Analysis of Method Comparison Studies. Stat 1983;32:307–17.
24. Altman DG, Bland JM. Parametric v Non-parametric Methods for Data Analysis. BMJ 2009;338:a3167.
25. Bland JM, Altman DG. Difference Versus Mean Plots. Ann Clin Biochem 1997;34(Pt 5):570–1.
26. Tinker M. Illumination Intensities Preferred for Reading with Direct Lighting. Aust J Optom 1944;27:435–9.
27. SeipleW. The Effects of Lighting on Reading Speed as a Function of Letter Size. Am J Occup Ther 2018;72:1–7.
28. Harrington RE. Effect of Color Temperature on Apparent Brightness. J Opt Soc Am 1954;44:113–6.
29. Sheedy JE, Bailey IL, Raasch TW. Visual Acuity and Chart Luminance. Am J Optom Physiol Opt 1984;61: 595–600.
Walter Wittich, PhD, FAAO,1,2,3* Lorie St. Amour, MSc,1 Jonathan Jarry, MSc,1 and William Seiple, PhD4,5
Join our Mission
Lighthouse Guild is dedicated to providing exceptional services that inspire people who are visually impaired to attain their goals.
